

Crash mechanics look chaotic from the outside: a multiplier shoots up, and at some random moment the round ends and anyone still in loses. Underneath, though, the multiplier curve is a tidy piece of probability. It is shaped so that, whenever you choose to cash out, the expected return equals a fixed number – the game’s RTP. This piece works out the math behind that curve: the core formula, how payout and survival trade off, and how a difficulty setting reshapes the whole thing.
What a Crash Mechanic Actually Is
A crash game has no reels or paylines. A multiplier starts at 1x and rises; the round can “crash” at any point, and the only decision is when to cash out before it does. There are two common shapes. In time-based crash games the multiplier grows continuously until a random crash point. In step-based ones a token advances one discrete step at a time, and each step either succeeds or ends the round. The underlying idea is the same in both: a rising payout multiplied by a falling probability of still being alive.
The Fair-Curve Formula
Step-based crash games like Chicken Road, which can even be installed as a PWA straight from the browser, make the model easy to see: each step is an independent trial with a fixed survival probability p. Suppose you commit in advance to cashing out after k successful steps. You reach that point with probability pᵏ, and there you collect a multiplier Mₖ. Your expected return per unit staked is therefore Mₖ · pᵏ. For the game to hand back the same RTP R no matter which step you choose, that product must stay constant, and that fixes the curve:
Mₖ = R × (1 / p)ᵏ
In words: the multiplier grows geometrically, multiplying by 1/p at every step. The derivation is short:
House Edge, RTP and the Crash Point
R is the RTP, and the house edge is simply 1 − R: a 98% game keeps 2% on average. The same structure appears in time-based crash games, where the crash multiplier m follows a survival law of P(M ≥ m) = R / m. Cash out at a target t and you win t with probability R/t, for an expected return of t · (R/t) = R once more. The table below shows the step-based version with p = 0.97 and a 98% RTP.
|
Step k |
Survival pᵏ |
Multiplier Mₖ |
|
1 |
0.970 |
1.01x |
|
3 |
0.913 |
1.07x |
|
5 |
0.859 |
1.14x |
|
10 |
0.737 |
1.33x |
|
20 |
0.544 |
1.80x |
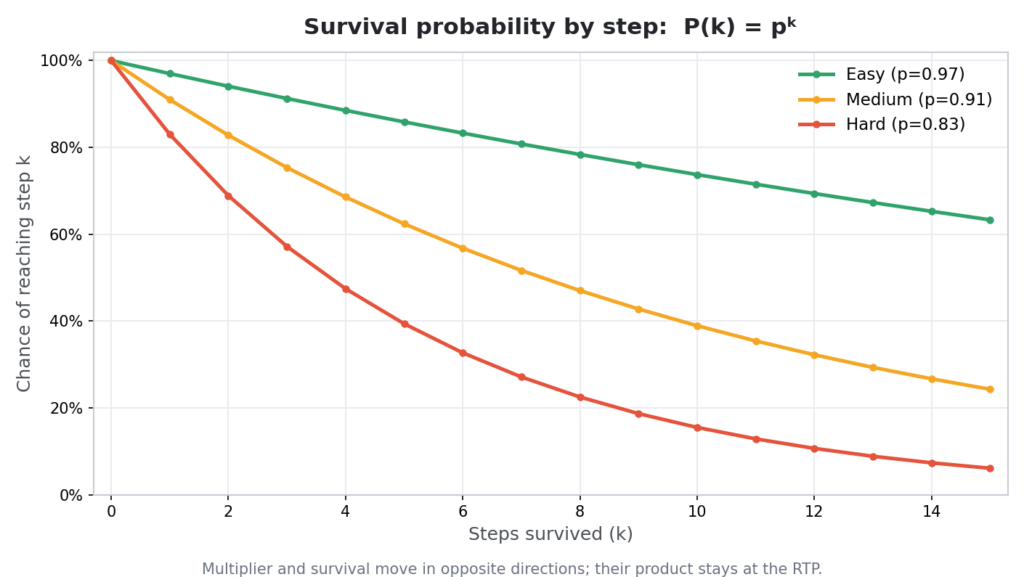
Notice the pattern: as the multiplier rises, the chance of getting there falls by just enough to keep the product at 0.98. That constant product is the house edge doing its quiet work.
How Difficulty Reshapes the Curve
A difficulty setting is really a choice of p. A harder mode lowers the survival probability, and two things happen at once. The multiplier gets steeper, because 1/p is larger, so big numbers arrive sooner. And survival decays faster, so you are far less likely to reach those numbers. The expected return does not move – only the shape of the risk does. What shifts with difficulty:
- Curve steepness: a lower p means a faster-climbing multiplier.
- Variance: harder modes trade frequent small wins for rare large ones.
- Typical run length: fewer steps before the round is likely to end.
- RTP: unchanged, since R is a separate parameter from p.
Why It Matters for Builders
For anyone implementing or auditing these systems, the curve is a two-knob design: R sets the long-run return, and p (the difficulty) sets the volatility. Both sit on top of a random number generator, and modern crash games expose a provably fair scheme so a player can verify a round after the fact. The point is that nothing about the multiplier is arbitrary – it is a distribution engineered to a target.
One caveat worth stating plainly: these are real-money gambling games, meant for players 18 and over. The math describes the long-run average across many rounds, not the outcome of any single one.

